What is RFM Analysis in Customer Segmentation?
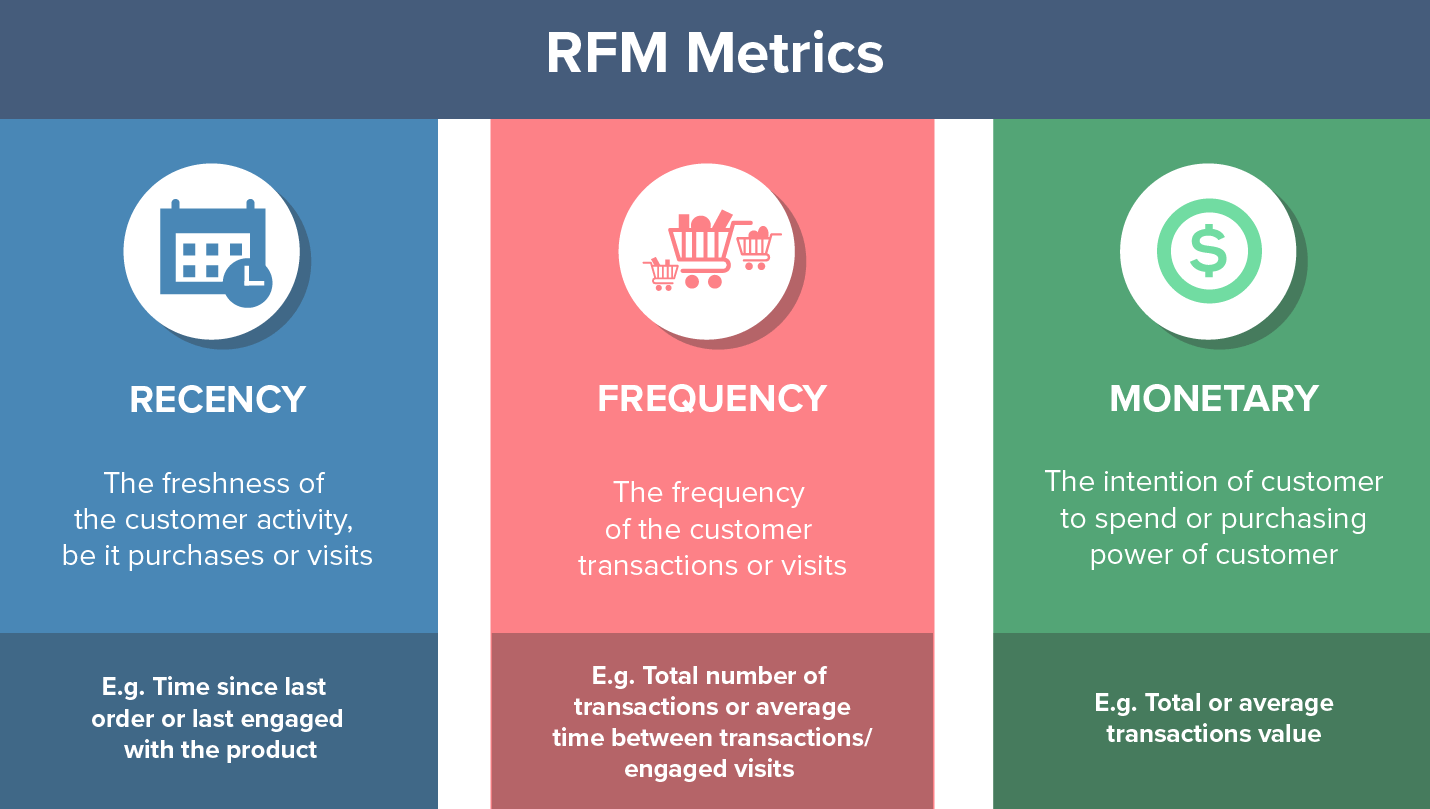
RFM Analysis is a marketing technique used to analyze and segment customers based on their past behavior. RFM stands for Recency, Frequency, and Monetary Value, and each of these factors plays a significant role in understanding customer behavior and identifying customer segments for targeted marketing strategies.
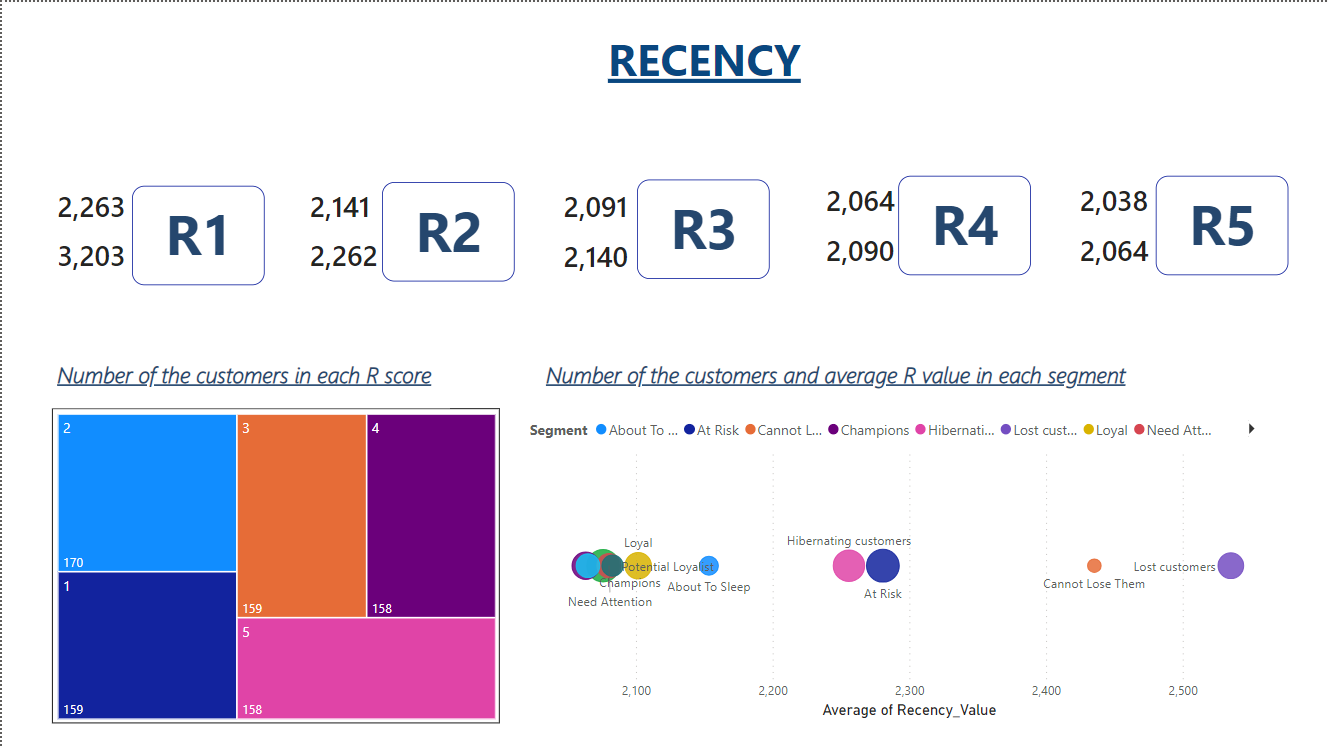
- Recency (R): How recently did the customer make a purchase?
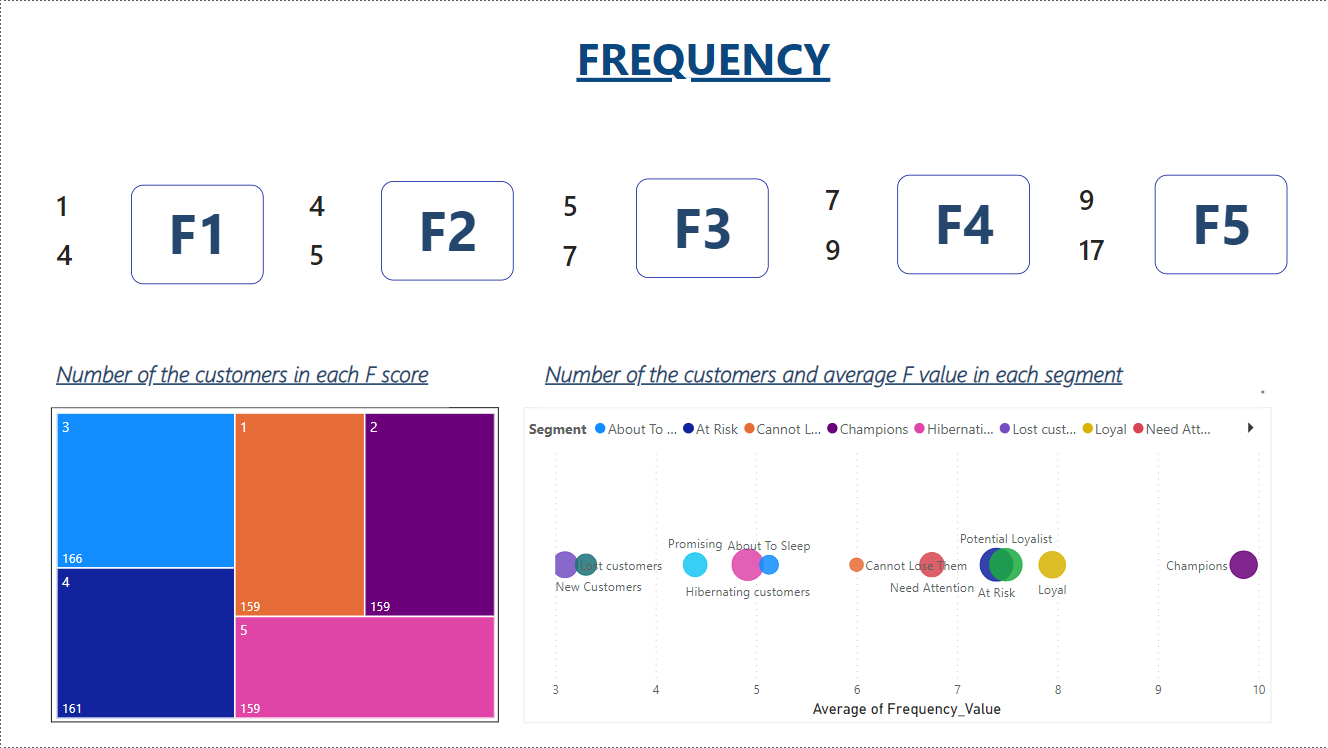
- Frequency (F): How often does the customer make purchases within a specific timeframe?
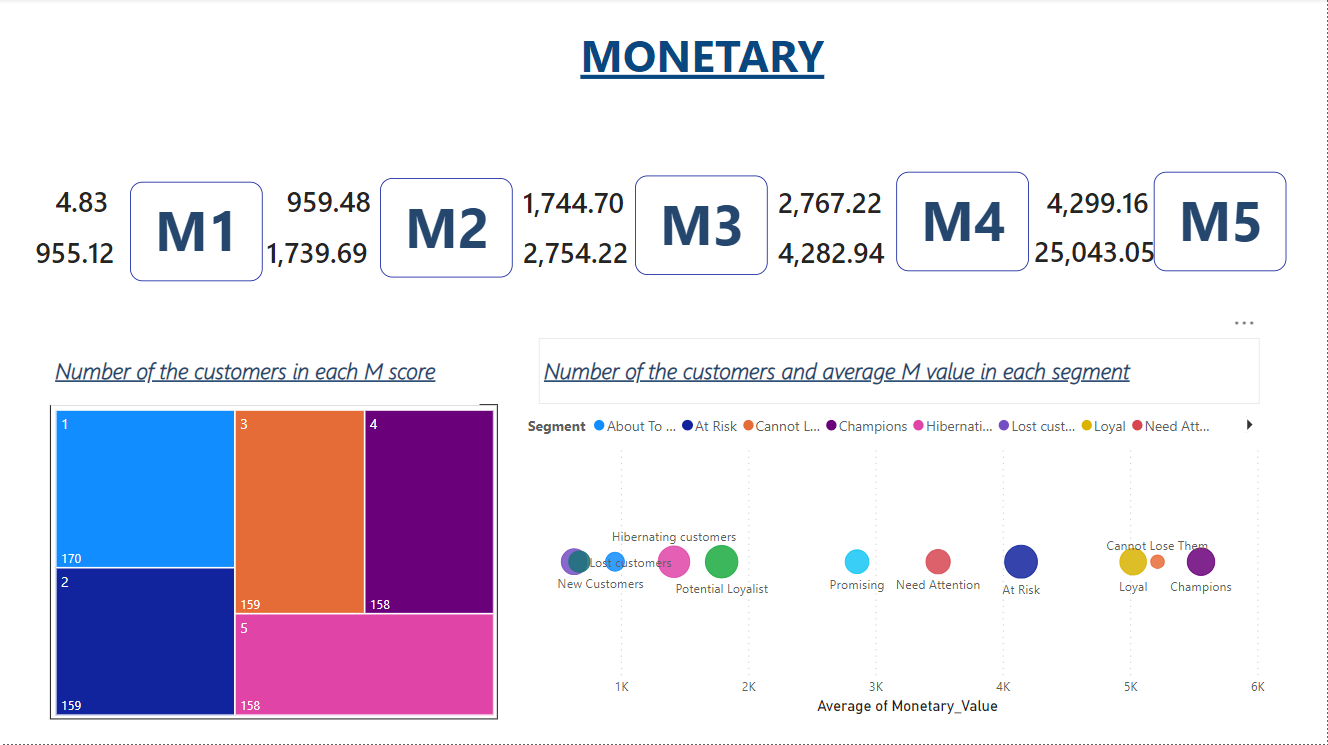
- Monetary (M): How much money has the customer spent within a specific timeframe?
RFM Customer Segmentation helps businesses better understand their customers, target specific segments with tailored marketing efforts, enhance customer loyalty, and increase profitability through optimized marketing strategies.
The Data Sources
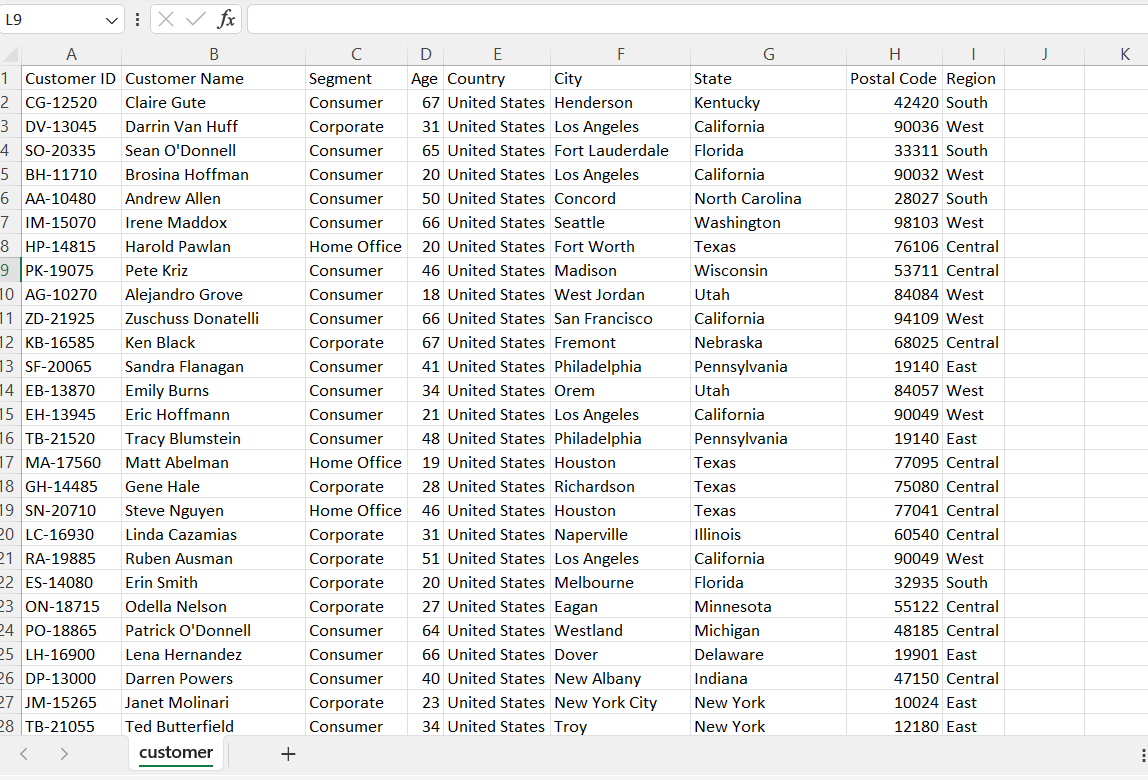
customer.csv
File data source customer.csv with columns: Customer, Customer Name, Segment, Age,...
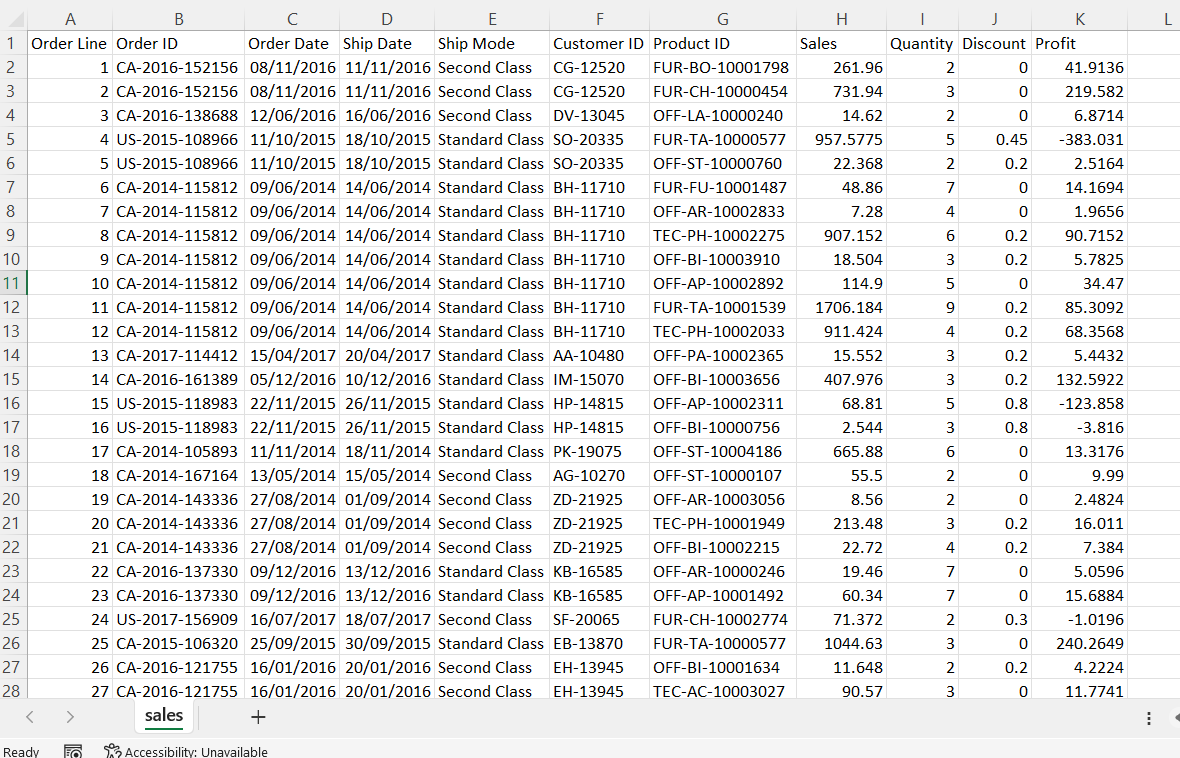
sales.csv
File data source sales.csv with columns: Order Line, Order ID, Order Date, Ship Date,...
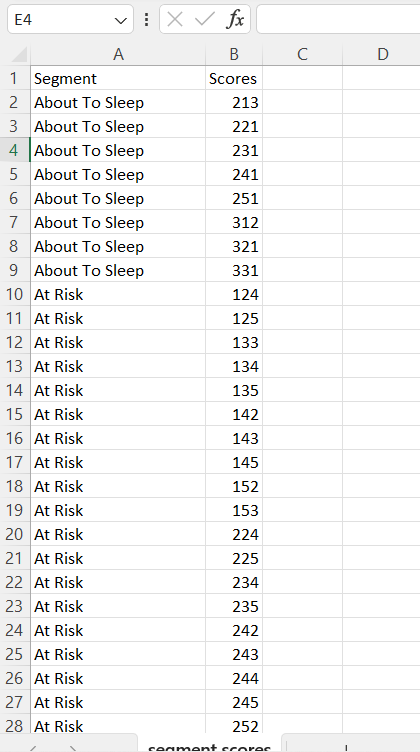
segment.csv
File segment scores.csv with two columns: Segment and Scores.
Download dataset in my repository: Here
SQL Script - Using RFM Analysis and Segment Scores
SELECT * FROM sales;
SELECT * FROM customer;
SELECT * FROM [segment scores];
-- -- -- -- -- -- -- RFM Calculate -- -- -- -- -- -- --
WITH RFM_Base
AS
(
SELECT s.Customer_ID as CustomerID,
c.Customer_Name AS CustomerName,
DATEDIFF(DAY, MAX(s.Order_Date), CONVERT(DATE, GETDATE())) AS Recency_Value,
COUNT(DISTINCT s.Order_ID) AS Frequency_Value,
ROUND(SUM(s.Sales), 2) AS Monetary_Value
FROM sales AS s
INNER JOIN customer AS c ON s.Customer_ID = c.Customer_ID
GROUP BY s.Customer_ID,c.Customer_Name
)
-- SELECT * FROM RFM_Base
, RFM_Score
AS
(
SELECT *,
NTILE(5) OVER (ORDER BY Recency_Value DESC) as R_Score,
NTILE(5) OVER (ORDER BY Frequency_Value ASC) as F_Score,
NTILE(5) OVER (ORDER BY Monetary_Value ASC) as M_Score
FROM RFM_Base
)
-- SELECT * FROM RFM_Score
, RFM_Final
AS
(
SELECT *,
CONCAT(R_Score, F_Score, M_Score) as RFM_Overall
-- , (R_Score + F_Score + M_Score) as RFM_Overall1
-- , CAST(R_Score AS char(1))+CAST(F_Score AS char(1))+CAST(M_Score AS char(1))
--as RFM_Overall2
FROM RFM_Score
)
-- SELECT * FROM RFM_Final
SELECT f.*, sg.Segment
FROM RFM_Final f
JOIN [segment scores] sg ON f.RFM_Overall = sg.Scores
;
-- -- -- -- -- -- -- Done -- -- -- -- -- -- --
In this script, I created some CTE (Common Table Expression) by using "WITH AS"
- 1. RFM_Base: calculating Recency Value, Frequency Value and Monetary Value
- Reecency Value: using DATEDIFF to Calculate the difference between the maximum order date of each customer (MAX(s.Order_Date)) and the current date (CONVERT(DATE, GETDATE()))
- Frequency Value: using COUNT(DISTINCT(Order_ID)) to count the number of distinct (unique) values of the "Order_ID"
- Monetary Value: using ROUND(SUM(s.Sales), 2) to calculate the rounded total of the "Sales", and round it by 2
- 2. RFM_Score: calculating the RFM scores for each customer based on their Recency_Value, Frequency_Value, and Monetary_Value. I used the NTILE function along with the OVER clause to distribute the customers into five equal-sized groups (quintiles) for each of the three metrics.
- 3. RFM_Final: concatenating the R_Score, F_Score, and M_Score to create an "RFM_Overall" value for each customer.
- 4. Finally, joining with segment table to find the segment for each customer
After that, I loaded this SQL Scripts to Power BI to visualize.
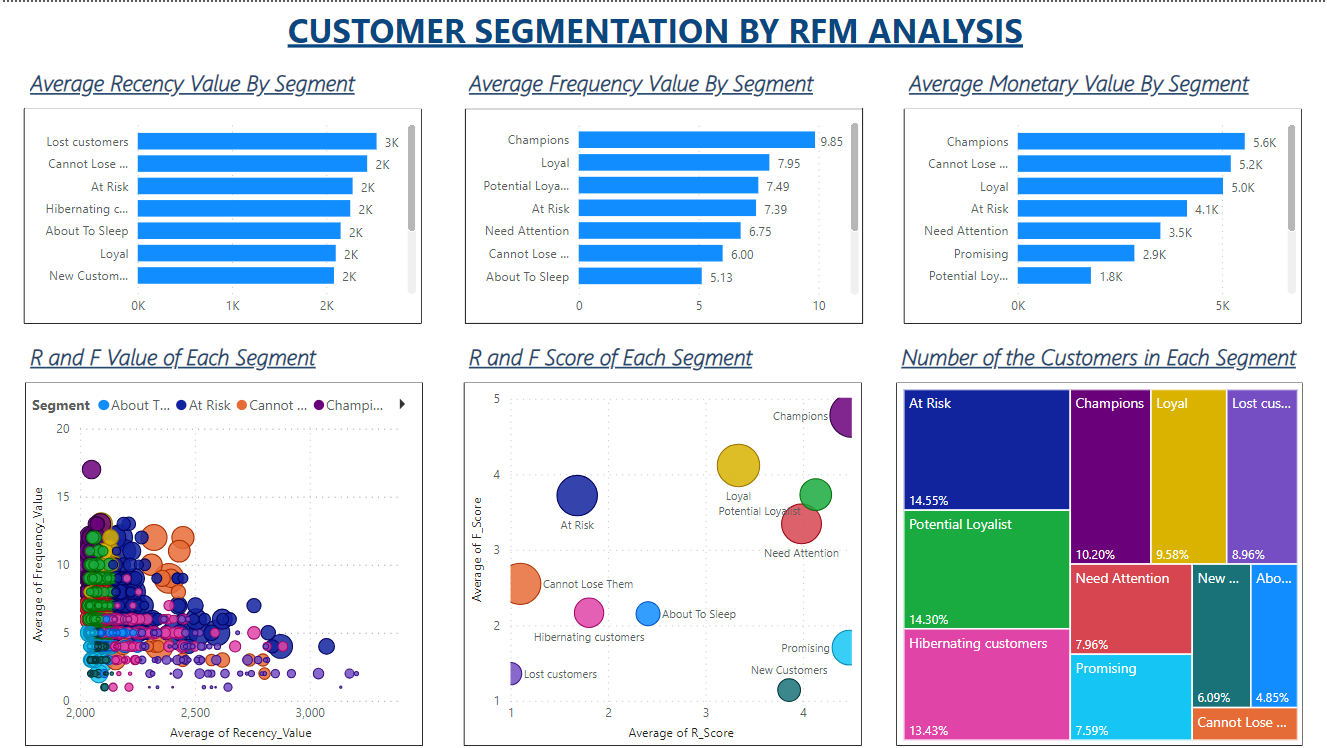
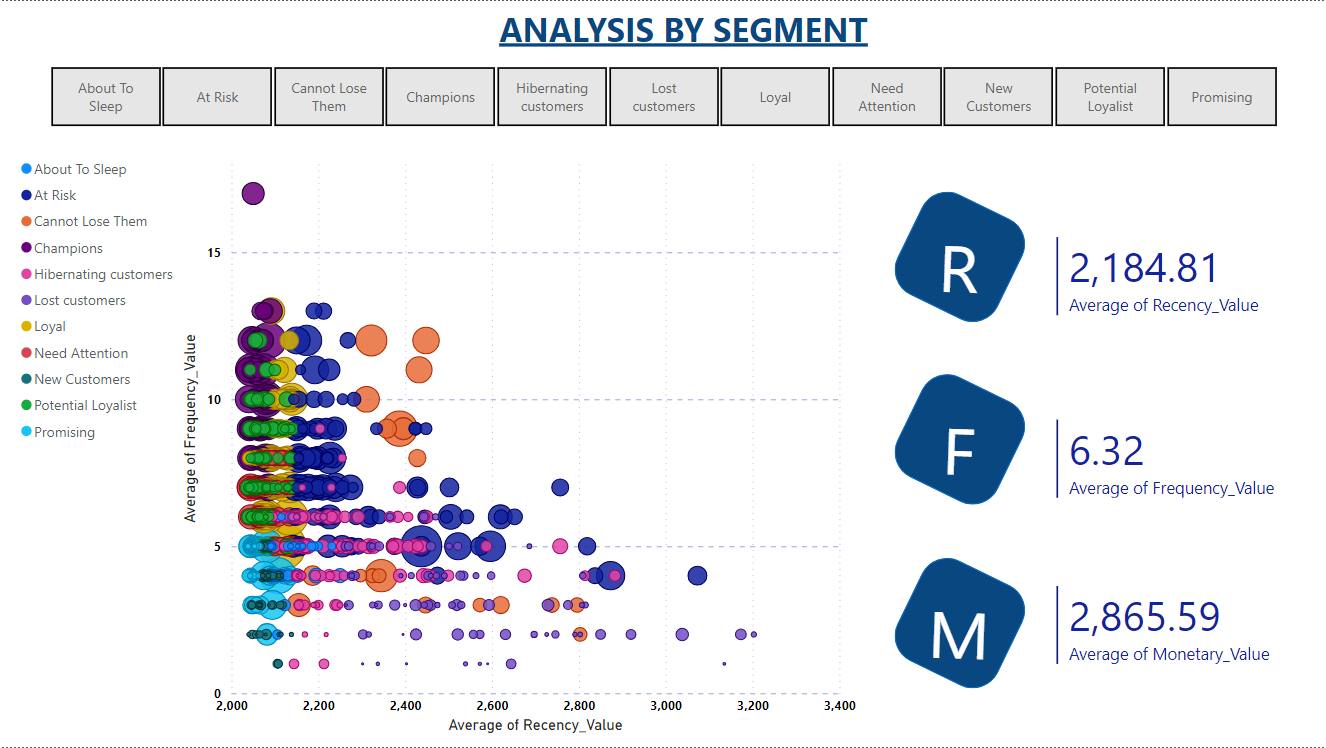
RFM Customer Segmentation Dashboard
Download the dashboard: Here
- At Risk, Potential Loyalist, and Hibernating Customer make up a significant portion (approximately 42%): These customer segments are at risk of becoming disengaged or require reactivation. The business needs to focus on retaining loyal customers in the Potential Loyalist group and re-engage Hibernating Customers through special promotions, discounts, or personalized customer care.
- Champions and Loyal account for a relatively high percentage (approximately 20%): These customer segments are highly valuable and loyal to the business. The company should maintain the satisfaction of Champions and strengthen customer retention efforts for the Loyal segment by improving the overall shopping experience and offering loyalty rewards.
- Lost Customer and Need Attention represent a notable percentage (around 17%): These segments consist of customers who are disengaged or need special attention. The business should concentrate on reactivating Lost Customers and improving interactions with the Need Attention group to retain and enhance satisfaction.
- Promising and New Customer account for a smaller portion (totaling nearly 14%): These segments have growth potential, and the business should develop strategies to enhance customer retention and engagement with these groups.
- About to Sleep constitutes a smaller percentage (4.85%): This segment is at risk of becoming disengaged, and the business should focus on retaining them through targeted promotions or product consultations.
In conclusion, based on the RFM analysis, the business should concentrate on customer retention, reactivating potential customers, strengthening interactions with valuable and potential segments, and developing engagement strategies to optimize business effectiveness and increase profitability.
View my full project: Here
Visits my social profile and get connected: